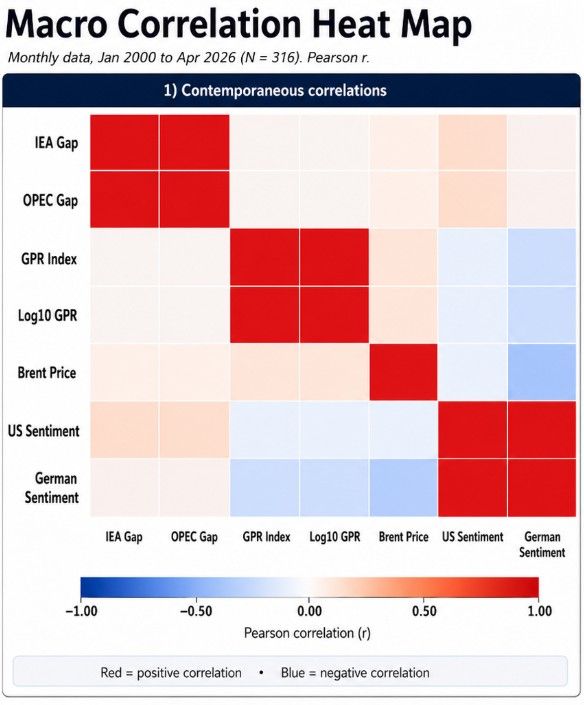

Quick screening of major government energy initiatives since 2000 across the EU, US, China, India and Japan found that only a small minority could be shown to have met their original timetable, budget and scope simultaneously.
That does not mean the remaining initiatives failed to create value. Ambitious policy targets give developers, investors, lenders and supply chains a direction around which they can plan. They encourage grid investment, accelerate technology development and create markets for renewable generation, flexibility and storage that might otherwise take much longer to emerge.
For investors, however, political ambition is not a bankable forecast. Delays in permitting, grid development, market integration and infrastructure delivery can materially change power prices, capture rates, BESS revenues and project timing. The gap between policy targets and realistic delivery therefore needs to be modelled, not ignored.
Missing an ambitious target while delivering structural change can be more valuable than meeting a cautious one. Yet the investment case must distinguish between the announced destination and the most credible route towards it.
This is where EnAuxo adds value. We translate policy ambition, infrastructure constraints and market fundamentals combined with mathematical methods into realistic scenarios and bankable revenue projections, helping investors and lenders understand not only where the energy system is heading, but how quickly it is likely to get there.
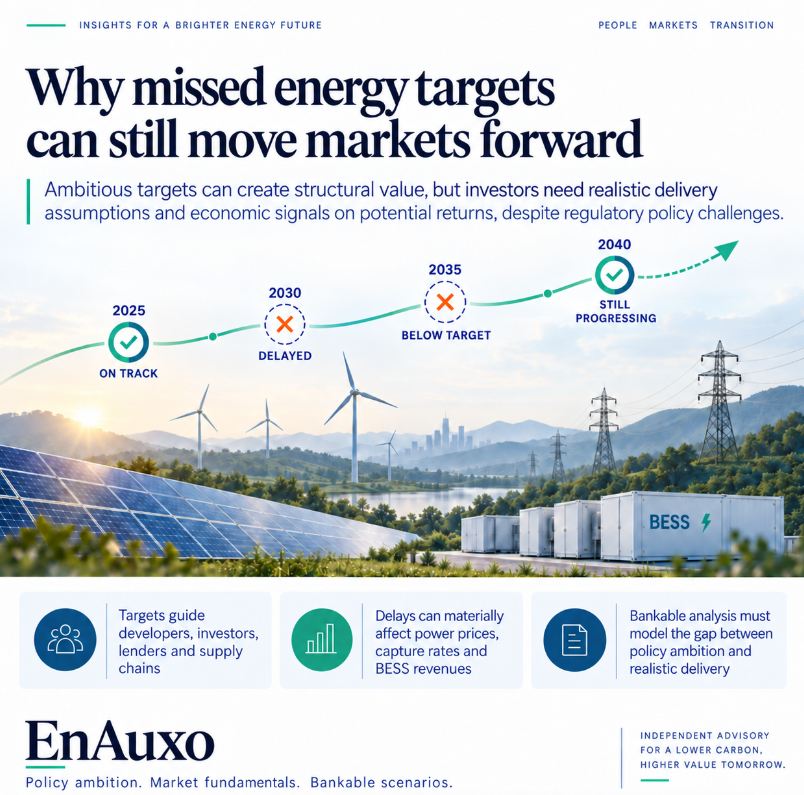
The 2026 Hormuz Strait crisis could not only be seen as a risk of sudden, further escalation, but as a conflict with far-reaching implications that could persist over a much longer horizon. History shows that resource wars are often defined less by a single shock than by prolonged attrition. In this case, the real constraint is not just the physical volume of oil and gas leaving the Gulf, but the rigidity of the systems that move, insure, refine, finance and consume them.
Insurance markets are the true gatekeepers of maritime passage; even where transit remains technically possible, commercial access can collapse, when and if ships cannot secure cover. At the same time, selective passage based on political alignment turns open commodity markets into a permit economy, where the flag on a tanker matters as much as, if not more than the cargo it carries.
The consequences extend well beyond crude oil balances. LNG disruption can cascade into semiconductor supply chains in Taiwan and South Korea, while, globally, refinery constraints limit the world’s ability to substitute between crude grades. Forced shut-ins at upstream fields risk lasting reservoir damage due to pressure, possibly turning temporary interruption into permanent loss of productive capacity. Disrupted fertiliser exports from the Gulf threaten food security on a delayed, yet global scale. Once strategic reserves are drawn down, the world enters an accelerating phase of economic vulnerability: this becomes a conflict of exhaustion, not merely one of blockade.
The key variable is not only how much energy is removed from the market, but how inflexible the global energy system proves under sustained stress.
In summary, what matters now isn’t just barrels or cubic metres per day, but rather it’s system rigidity over time:
- Insurance markets deciding who can sail through
- LNG disruptions potentially cascading into semiconductors in particular markets, especially in Asia
- Reservoir damage turning temporary shocks permanent
- A shift from open markets to political permit systems
- Refinery limits blocking crude substitution
- Fertiliser shortages threatening future food supply
- Strategic reserves defining a finite window of resilience.
This is no longer a flow problem only, but a system’s stress test over time.
Unfortunately, in prolonged resource conflicts, the system resilience can break before the resource runs out.
At EnAuxo, we are updating our input assumptions to account for the latest energy system dynamic conditions, plus resulting impact on especially gas and power prices.
PLEXOS Power Market Model from Energy Exemplar is very good with long-term projections over 20-30-40 years ahead, naturally when it has relevant inputs.
It can also project relatively accurately the near-end of the curve, even at volatile times as with the present conflict in the Strait of Hormuz (for reference, kindly see posts from several months ago on the politically-charged conflict of attrition lasting a while, plus on the Energy Curtain gas and power price resulting escalation in CSEE).
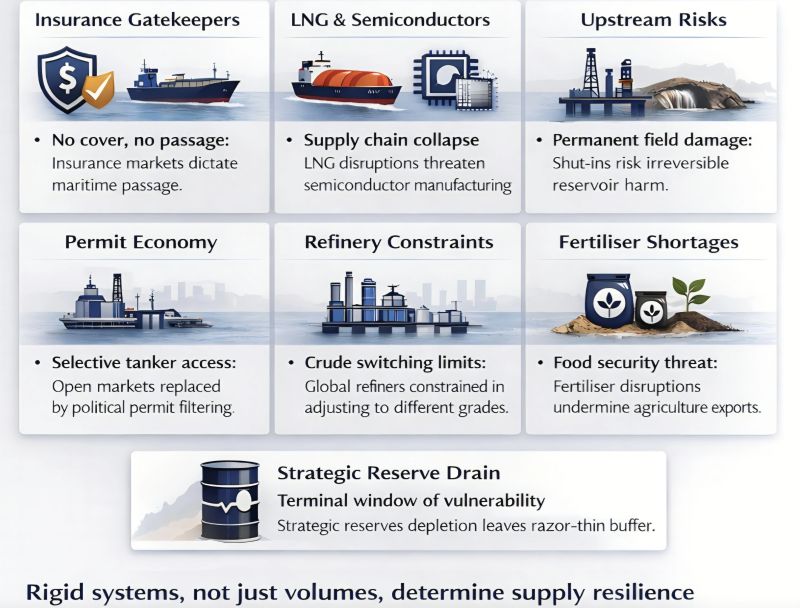
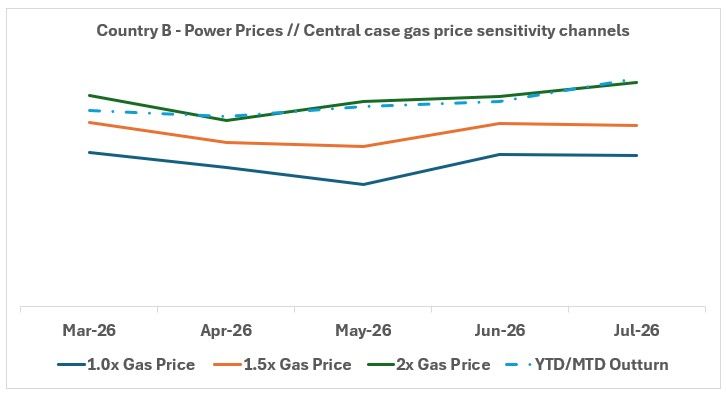
Below in attached graphs are examples of quick turn-around work done for a complex Stakeholder group, including lenders, Project owners / developers and so forth (modelled on the weekend when the Strait of Hormuz crisis started) with a mathematical and fundamental approach at end-February for A) CEE and B) SEE countries that show a broadly justifiable with PLEXOS mid-term trend on monthly wholesale electricity prices.
We further reacted and had updated within a short period our Q1 2026 modelling results. In subsequent quarters, we are reflecting the escalated energy markets situation for a certain period on the forward curve.
NB re. graphs : the notations and calculated power prices for main Central scenario only with gas prices at 1.0x Gas Price // 1.5x Gas Price // 2x Gas Price refer to initial fuel costs level expected prior to the Hormuz conflict flaring in February 2026. Based on over 20,000 mathematical simulations, it was deemed that escalated gas prices for Central case will be more likely for 2026 and that for a certain period the “new Central” scenario is within the shown envelope channels (with May slightly adjusted for SEE hydrology situation in B). The graphs show that the forward monthly power price simulations were broadly in line with the YTD / MTD outcomes for wholesale power prices in the two respective countries modelled, A and B (in CEE and SEE respectively) and largely within or near the modelled Central envelope gas price sensitivity ranges.
#PowerandGasPrices #CSEE #Plexos #MarketModelling #EnAuxo
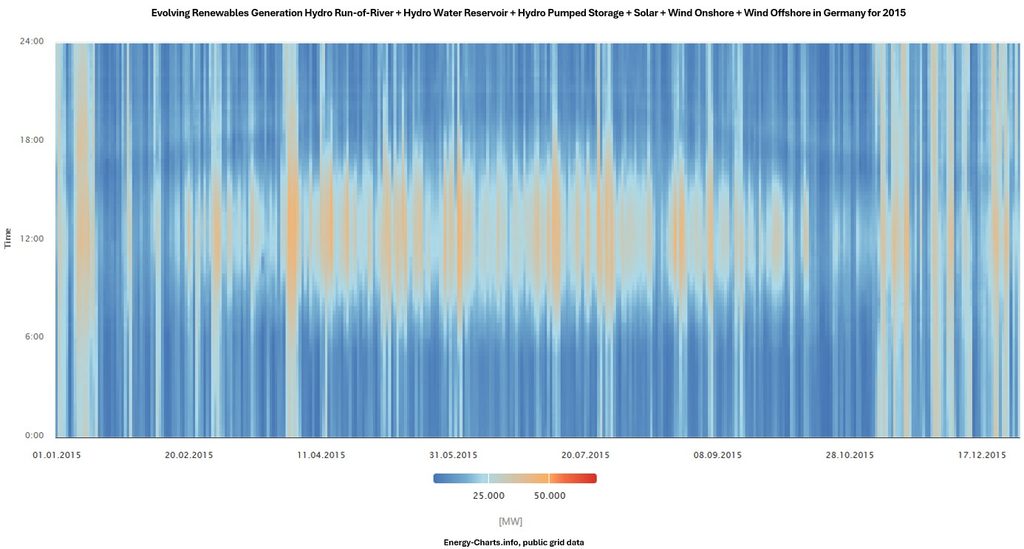
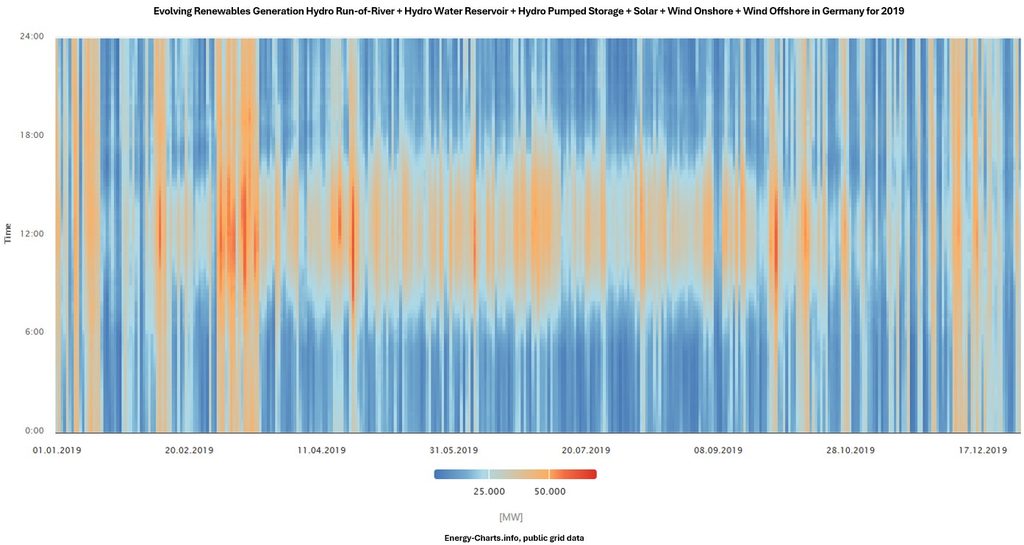
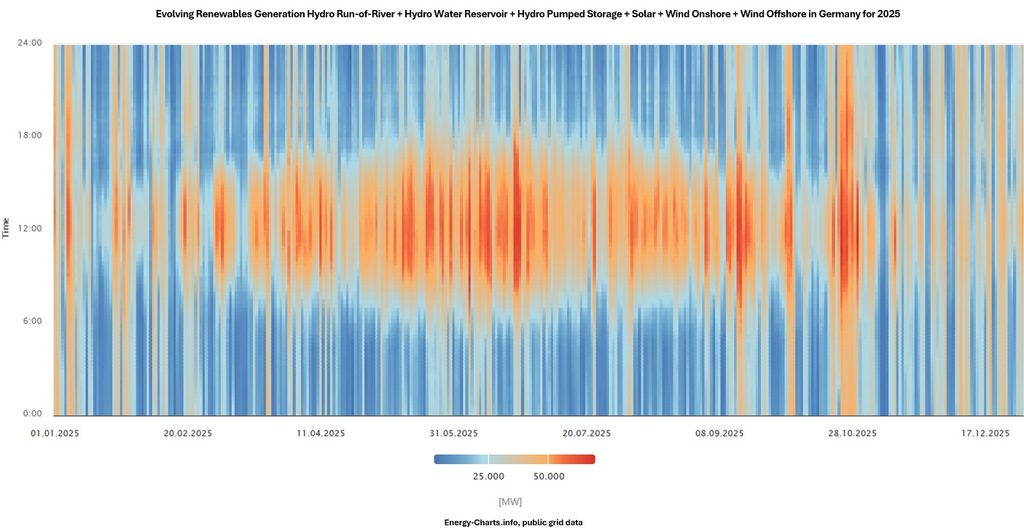
For years, European power-price formation was explained mainly through the classical merit order: fuel and carbon prices, demand, generation capacity, and cross-border flows, and other related fundamentals drivers.
Recently, the new price formation is further shaped by a complex interaction of:
– Solar surplus and negative, or low-priced periods
– Evening and/or seasonal ramp scarcity
– Wind, hydro, thermal availability across short intervals and seasonal patterns
– Grid congestion and redispatch bottlenecks
– Storage opportunity costs, e.g. BESS and pumped hydro
– Intraday forecast errors and balancing-market stress
– Demand-side flexibility re. industry, EVs, heat pumps, data centres, and so forth.
The key question now:
„Which flexibility resource sets the opportunity cost at this location, under this specific system condition in a particular short period?“
A robust power-price projection can no longer just project annual averages. It’s key to explain why and how prices form across temporal periods in DAM, IDM, balancing and ancillary-service markets.
This is where bankable modelling evolves. At EnAuxo, we combine energy market fundamentals with advanced, multivariable, multi-iteration mathematical modelling to capture this new price-formation framework. We help our Clients navigate:
=> Residual-load dynamics and renewable cannibalisation
=> Capture prices and curtailment/volume/profile risks
=> Volatility, spread formation and storage shadow values
=> Cross-border optionality and grid scarcity
=> Complex flex structures including tolling, floor pricing with profit sharing, swaps with fixed and/or floating set-ups, bespoke and dynamic terms PPAs
=> Downside scenarios for debt sizing and DSCR resilience, amongst other business cases. In the past couple of months alone, EnAuxo has analysed multiple/dozens business cases across a number of key CSEE markets for standalone and hybrid BESS investments. By
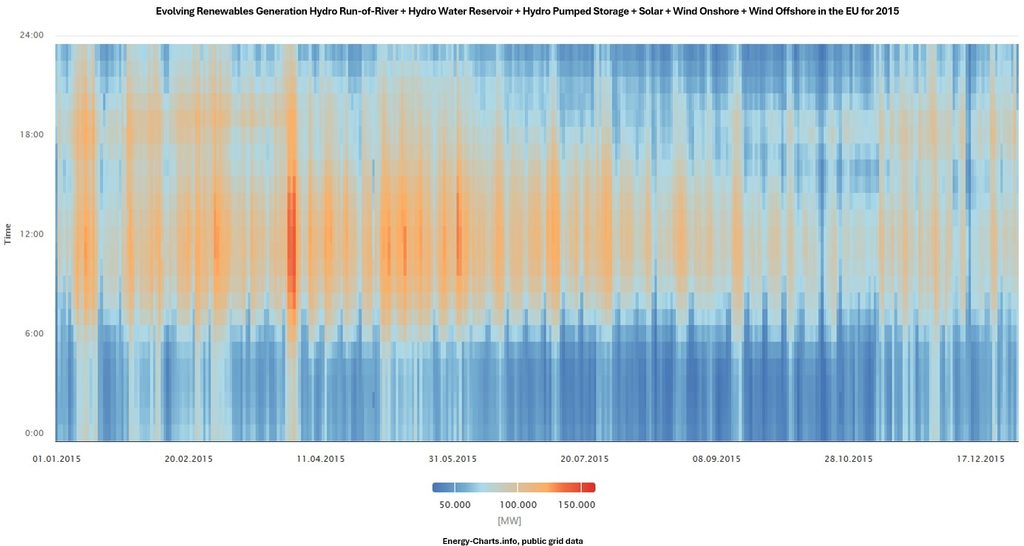
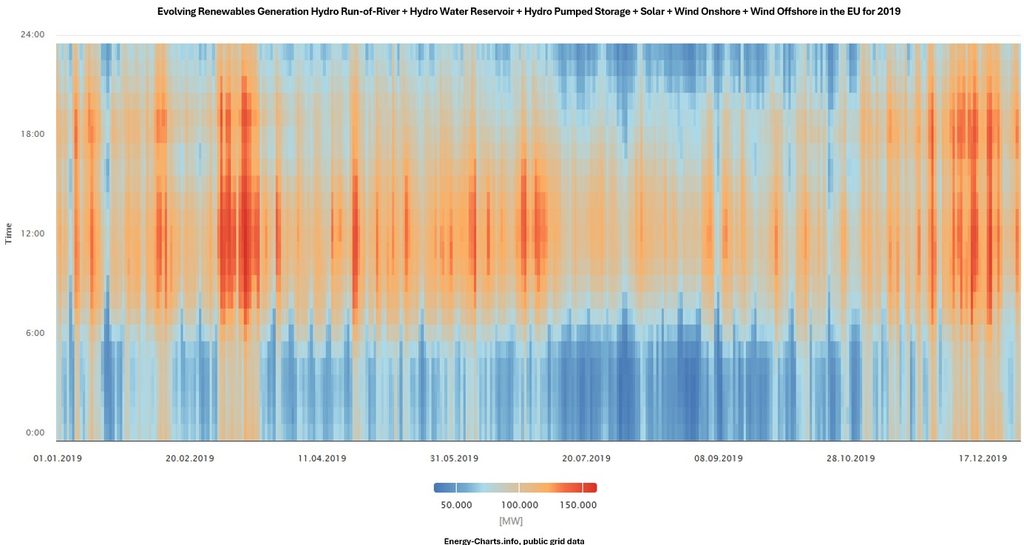
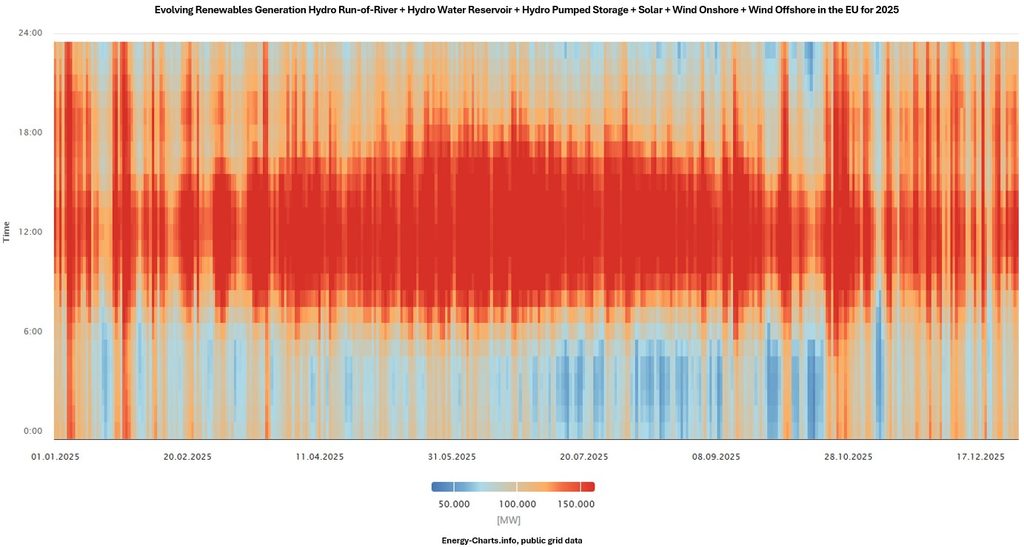
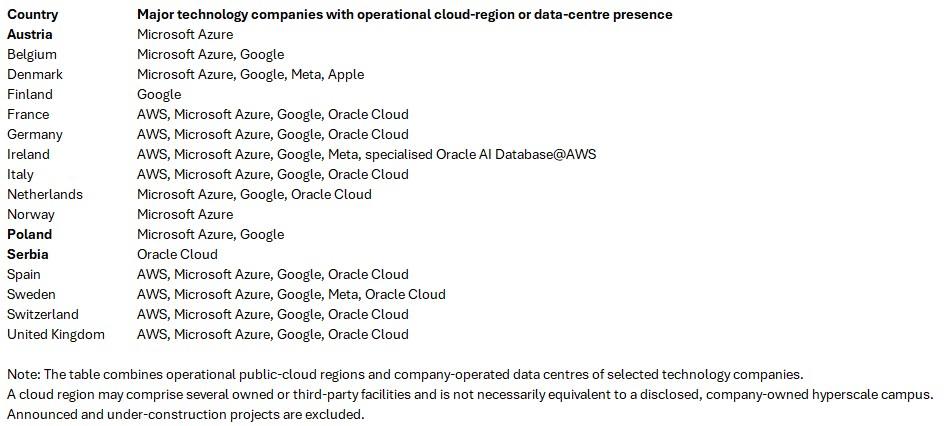
Data centres could become one of the most important new sources of electricity demand in Central and Southeast Europe, yet a bankable projection should distinguish operating infrastructure from announcements. Poland already hosts the operational Microsoft Azure Poland Central and Google Cloud Warsaw regions, while Microsoft’s Austria East region has been live since 2025 and Google’s Kronstorf campus in Austria is still under development (public sources info). This emerging footprint confirms the direction of travel, while it also shows that CSEE remains at an earlier stage than Europe’s established – with multiple installations – Western and Nordic data-centre markets.
Announced capacity is not the same as realised power demand. A credible model must reflect the time required to secure land, permits, fibre connectivity, grid capacity, equipment, financing and anchor customers, thus, followed by a gradual occupancy and IT-load ramp-up. Hyperscale utilisation of normally around 40 to 50% and local or enterprise-server utilisation of approx. 18 to 23% can be used as transparent modelling assumptions on an annual average basis, but not as fixed outcomes. If cloud, AI or colocation revenues develop more slowly than expected, operators can delay fit-out, postpone later phases or replacing chips after a few years (likely required after only ca. three years for certain hyperscale data centres!), or energise substantially less load than the site’s headline connection capacity.
A possibility is therefore not to exclude data centres, but to probability-weight them and introduce them within statistical confidence intervals as related to each bankable scenario. The central case should include only projects with credible sponsors, secured sites, advanced permitting, identifiable grid connections and realistic commissioning schedules; more speculative announcements or early plans only belong in the high scenario, and/or are to be somewhat delayed in time. As CSEE has already experienced with long lead times on hydrogen and e-mobility, especially compared to initial expectations, a compelling long-term narrative for data centres does not guarantee rapid near-term electricity consumption impact.
Data centres are a potentially critical demand-growth driver, and EnAuxo believes their impact is likely to be phased, uneven and slower than headline pipelines suggest. Just as in European markets regarding power price trends, an East-West divide is emerging in data-centre development as well: Western and Northern Europe already host much of the operational capacity, while Central and Southeast Europe experience a more selective, gradual growth story.
Recent posts focused on geopolitics and modelling gas price escalation, both important, but somewhat incomplete.
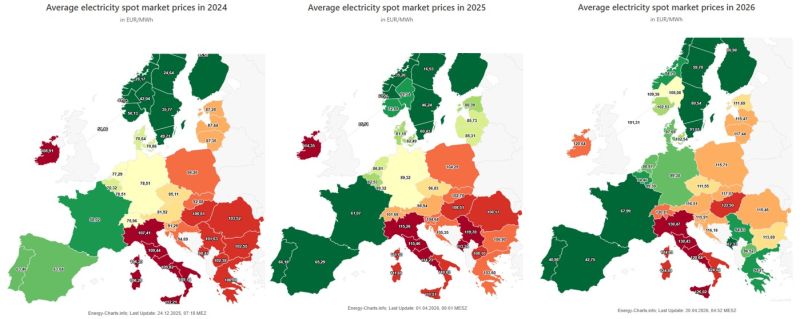
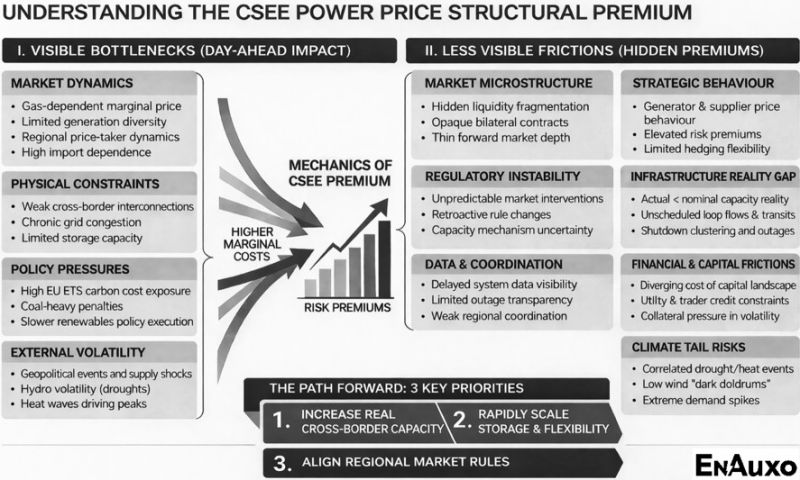
CSEE power prices are shaped by a broader set of structural drivers, forming an “energy curtain” that sustains both higher levels and volatility in the past few years.
The summary charts below outline the full mechanics, noting that said effects are played out to various degrees across the power markets in the region.
At first glance, H1 2026 open forwards suggest a green sea of stability (see chart below). However, the right-hand-side heatmap reveals the impact of a gas price escalation, based on 2022 fuel costs, creating a larger than 60% delta and a clear risk zone.
Recent geopolitical events (e.g. conflict affecting the Strait of Hormuz, outlined in previous post) show how quickly gas prices can spike. When gas-fired generation is marginal, these costs rapidly transmit into power prices under Europe’s current merit-order system.
For energy-intensive consumers and portfolio managers in CSEE, seemingly stable forwards are therefore conditional expectations, not protection against tail risk or extreme events. This sensitivity even excludes other stress factors seen in recent years, such as nuclear plant outages or low wind.
While current EEX forwards (ca. mid-April 2026) indicate stabilisation, our stress-testing highlights a clear volatility risk. Power markets across CEE/SEE remain structurally exposed to gas price shocks, each of them impacted to a different degree as per particular generation mix, fuel price rigidity, cross-border flows, etc. drivers:
=> The Higher Risk Premium: if gas prices were to mirror the 2022 escalation, power prices in CSEE would significantly surge above the current forwards, which were already partly reflecting an escalated fuel and electricity costs backdrop.
=> The RES-E Myth: adding renewables and flexibility to the system is vital, but it isn’t a silver bullet. These measures alone cannot fully insulate industrial and other key consumers from a systemic gas-driven price shock.
=> Fragile Stability: relying solely on spot prices in this environment can be risky with margins, whereby a strategy to manage said volatility is rather critical. Margin exposure can escalate quickly without a structured approach to volatility.
Turning energy price dynamics into a competitive advantage: at EnAuxo, we go beyond a base case framework. We model both probable scenarios and extreme stress conditions, delivering actionable insights across the region – from Serbia to Poland – that can secure energy portfolios also in stress conditions.
PS: Heatmap enclosed comparing monthly baseload power prices (EUR/MWh) for Bulgaria, Czechia, Hungary, Poland, Romania and Serbia, showing Jan. to Mar 2026 outturn, Apr to Jun 2026 EEX forwards, and a 2022-style gas-price shock sensitivity with large upside risks in certain electricity markets…
hashtag#EnergyMarkets hashtag#RiskManagement hashtag#EnergyTransition hashtag#EnAuxo hashtag#CEE hashtag#SEE hashtag#PowerPrices hashtag#MarketIntelligence

A recent sensitivity analysis evaluating accelerated onshore wind deployment across CSEE by 2030 (relative to 2026 installed capacity) reveals significant market impacts:
=> Regional Baseload Softening: Joint, uncoordinated wind acceleration across CSEE results in a modelled regional baseload price reduction of approximately EUR 7 to 9/MWh across the power markets analysed, in real 2026 terms as per enclosed high-level indicative chart.
=> Capture Price Cannibalisation: For IPPs and renewable sponsors, the key risk extends beyond baseload erosion to the potential widening gap between baseload and wind-weighted capture prices as wind penetration increases.
=> Structuring and Flexibility: Protecting target equity returns and supporting bankable PPA structures can increasingly favour hybridisation with Battery Energy Storage Systems (BESS), flexible contracting and diversification across less-correlated bidding zones.
=> Cross-Border Basis Risk: Uneven RES-E deployment across interconnected CSEE markets could reshape cross-border spreads and basis risk, adding complexity to cross-zonal hedging strategies.
While accelerated wind deployment can benefit consumers through lower wholesale electricity prices, managing capture-price cannibalisation and monetising flexibility will become increasingly important to renewable project bankability through 2030 and likely thereafter.
#EnergyMarkets #Renewables #PowerTrading #BESS #PPA #CSEE #EnergyTransition #EnAuxo
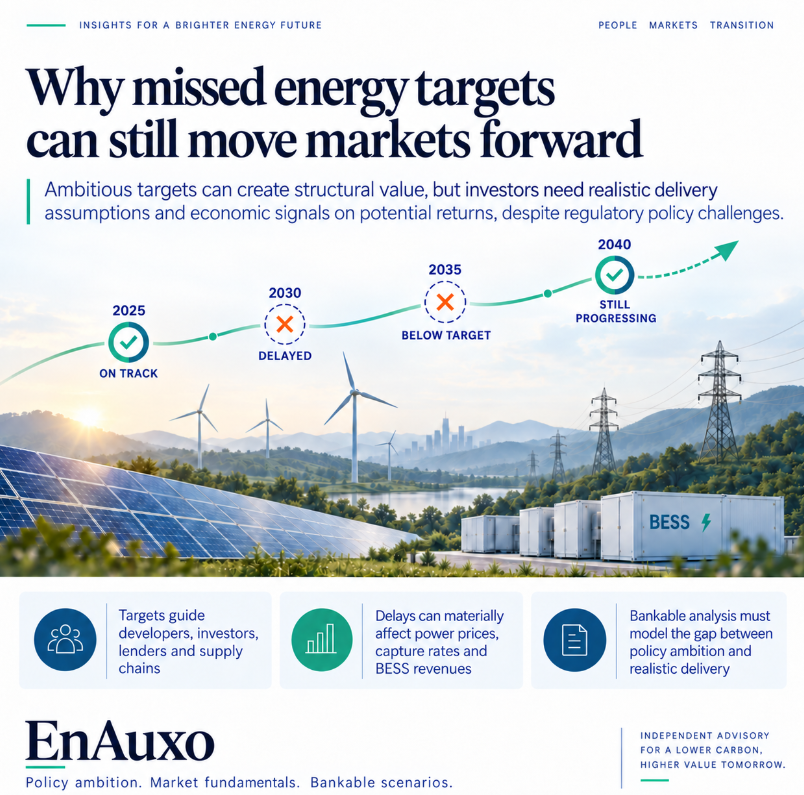
Quick screening of major government energy initiatives since 2000 across the EU, US, China, India and Japan found that only a small minority could be shown to have met their original timetable, budget and scope simultaneously.
That does not mean the remaining initiatives failed to create value. Ambitious policy targets give developers, investors, lenders and supply chains a direction around which they can plan. They encourage grid investment, accelerate technology development and create markets for renewable generation, flexibility and storage that might otherwise take much longer to emerge.
For investors, however, political ambition is not a bankable forecast. Delays in permitting, grid development, market integration and infrastructure delivery can materially change power prices, capture rates, BESS revenues and project timing. The gap between policy targets and realistic delivery therefore needs to be modelled, not ignored.
Missing an ambitious target while delivering structural change can be more valuable than meeting a cautious one. Yet the investment case must distinguish between the announced destination and the most credible route towards it.
This is where EnAuxo adds value. We translate policy ambition, infrastructure constraints and market fundamentals combined with mathematical methods into realistic scenarios and bankable revenue projections, helping investors and lenders understand not only where the energy system is heading, but how quickly it is likely to get there.
EnAuxo’s market intelligence models connect global energy fundamentals, fossil fuel prices, macro sentiment, and European energy price economics in specific business cases.
(as initially shared in May 2026)
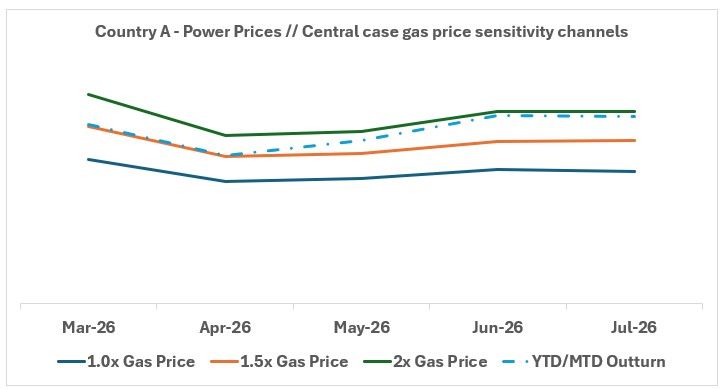
Macro-trend correlation coefficients may point to statistically significant signals, especially when certain time lags are applied (note, Heat Map enclosed below shows contemporaneous correlations only), whereby high-level examples on contemporaneous and time-lag correlations are:
– IEA and OPEC supply-demand gap indicators move almost in lockstep (r = 0.99), while unsurprisingly OPEC consistently forecasts higher oil demand growth than the IEA, based on crude oil backdrop data over the long-term, e.g. given more optimistic GDP growth views and different perspectives on the energy transition.
– Higher Brent crude oil prices are associated with weaker German economic sentiment around seven months later (r ≈ -0.35).
– OPEC Gap and Geopolitical Risk Index show a statistically significant negative relationship at a 24-month lag (r ≈ -0.43).
– US and German economic sentiment are strongly aligned (r = 0.82).
These macro linkages matter, since global energy stress can flow into European gas and power markets. When elevated fossil fuel prices coincide with renewable intermittency, wholesale electricity price volatility can intensify. Coupled with its fundamentals modelling methodology, EnAuxo translates these statistically grounded signals into bankable strategies for flexible assets such as BESS, helping investors identify and monetise arbitrage opportunities during periods of peak volatility.